HPE Business
Value Dashboard
Visually align IT to business KPIs.

HPE Business Value Dashboard
Visually align IT to business KPIs.


BVD SaaS Packages
Looking for real time business analytics but don’t know how or where to start?
Get up and running with our new BVD SaaS Packages. Choose the option that best
fits your needs and get started today.
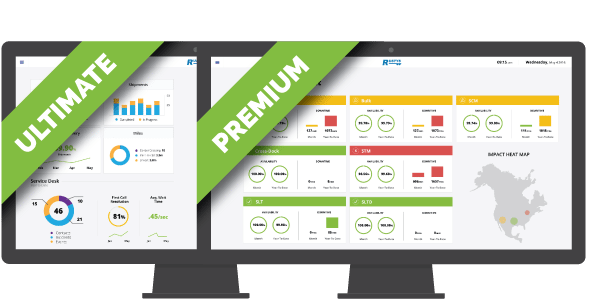
Bridge the Information Gap
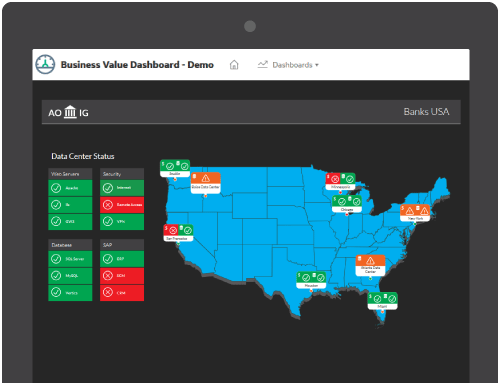
HPE Business Value Dashboard is a powerful, yet simple dashboard solution that allows organizations to create custom displays of key IT and Business metrics to bridge the information gap for strategic decision making.
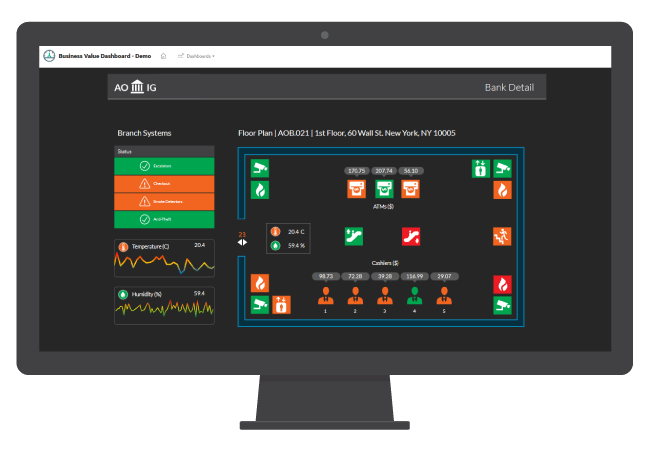
Design Custom Templates
With out-of-the-box dashboard templates, you can have your HPE Business Value Dashboard up and running in no time. HPE BVD works with Microsoft Visio, so creating a user interface is simple and intuitive.

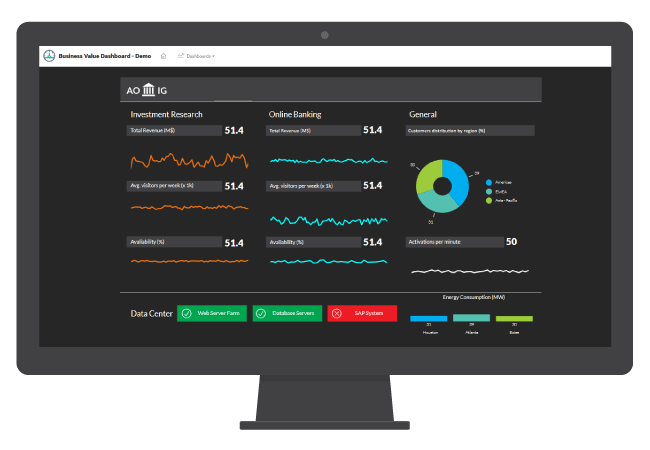
Simple Data Source Integration
Along with flexibility for design, HPE BVD also integrates with existing HPE software as well as many 3rd party data sources. Easily integrate any data stream, RSS feed, or streaming video collected from anywhere.

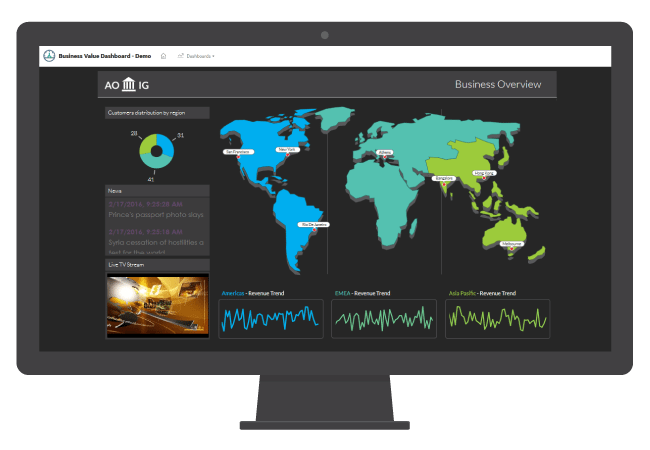
Personalized Dashboards
You have the power to build a unique view of how your business is performing by creating display mashups. Show key metrics alongside statuses, geographical information, and other data visualizations that are important to you.

Bridge the Information Gap
HPE Business Value Dashboard is a powerful, yet simple dashboard solution that allows organizations to create custom displays of key IT and Business metrics to bridge the information gap for strategic decision making.

Design Custom Templates
With out-of-the-box dashboard templates, you can have your HPE Business Value Dashboard up and running in no time. HPE BVD works with Microsoft Visio, so creating a user interface is simple and intuitive.


Simple Data Source Integration
Along with flexibility for design, HPE BVD also integrates with existing HPE software as well as many 3rd party data sources. Easily integrate any data stream, RSS feed, or streaming video collected from anywhere.


Personalized Dashboards
You have the power to build a unique view of how your business is performing by creating display mashups. Show key metrics alongside statuses, geographical information, and other data visualizations that are important to you.

HPE Business Value Dashboard Services
Design & Implementation
ResultsPositive has already successfully implemented HPE Business Value Dashboard to one of USA’s leading food distributors. With a dedicated team of developers, we can help you implement HPE BVD so it becomes a strategic tool that can help your business drive value by supporting information driven decision making.

Ask us about HPE Business Value Dashboard.

Get started with HPE BVD.

